Dieses Wiki, das alte(!) Projektwiki (projektwiki.zum.de)
wird demnächst gelöscht.
Bitte sichere Deine Inhalte zeitnah,
wenn Du sie weiter verwenden möchtest.
Gerne kannst Du natürlich weiterarbeiten
im neuen Projektwiki (projekte.zum.de).Datei:GDP per capita of China and India.svg
Aus Projektwiki - ein Wiki mit Schülern für Schüler.

Größe dieser Vorschau: 530 × 396 Pixel.
Volle Auflösung (SVG-Datei, Basisgröße: 750 × 560 Pixel, Dateigröße: 11 KB)
Beschreibung
| Beschreibung |
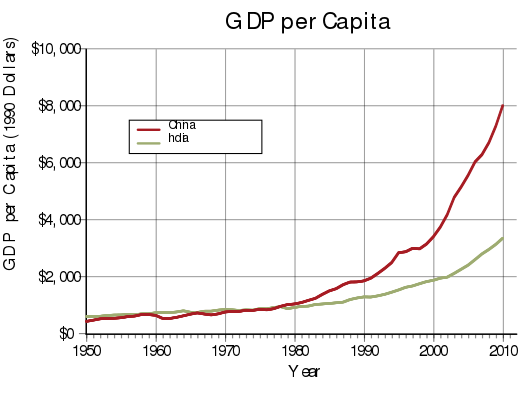
English: Per capita GDP of China and India, in constant 1990 dollars. Data from Maddison Project Database January 2013 |
| Datum | |
| Quelle | Eigenes Werk |
| Urheber | Delphi234 |
Generated with Wikimedia SVG Chart
| Data format | The source data of the chart is in the SVG image file in a clearly readable format. You see the original numbers inside of the SVG file in the form of a list such as this:
... 1995 10.06 1996 11.75 1997 12.45 ... |
| Content of SVG | To view the data download the SVG file itself. To do so right-click this link, and then choose the option to save: File:GDP per capita of China and India.svg. Launch any text editor. Open the downloaded SVG file with the text editor (usually; file menu, open). To see the list of data, search for the phrase id="graph1". |
| Please, do not use a special SVG editor such as Inkscape; the readability of the database would be destroyed. You can edit the SVG file with any text editor, for example; en: List of text editors. You can view the edited SVG file in various web browsers. As of 2011, all major desktop browsers, and many minor ones, have some level of SVG support. See: en: Scalable Vector Graphics#Support for SVG in web browsers. When satisfied with your edits, upload the edited SVG file with the link labeled "Upload a new version of this file".
W3C-validity not checked. This chart was created with Wikimedia SVG Chart. Dieses Chart verwendet Text/Zahlen-Einbettung. |
|
| Code to generate SVG | See: File talk:GDP per capita of China and India.svg. Documentation see: Wikimedia SVG Chart. |
Lizenz
Ich, der Urheber dieses Werkes, veröffentliche es unter der folgenden Lizenz:
| Diese Datei wird unter der Creative-Commons-Lizenz „CC0 1.0 Verzicht auf das Copyright“ zur Verfügung gestellt. | |
| Die Person, die das Werk mit diesem Dokument verbunden hat, übergibt dieses weltweit der Gemeinfreiheit, indem sie alle Urheberrechte und damit verbundenen weiteren Rechte – im Rahmen der jeweils geltenden gesetzlichen Bestimmungen – aufgibt. Das Werk kann – selbst für kommerzielle Zwecke – kopiert, modifiziert und weiterverteilt werden, ohne hierfür um Erlaubnis bitten zu müssen.
|
Dateiversionen
Klicke auf einen Zeitpunkt, um diese Version zu laden.
| Version vom | Vorschaubild | Maße | Benutzer | Kommentar | |
|---|---|---|---|---|---|
| aktuell | 05:51, 16. Dez. 2014 | | 750 × 560 (11 KB) | Delphi234 | User created page with UploadWizard |
Dateiverwendung
Die folgende Seite verwendet diese Datei: